Have you ever wondered why some businesses thrive while others fall behind, even though they have access to the same data? The difference lies in what they do with it. A report isn’t just a collection of numbers—it’s a roadmap for action. For businesses juggling campaigns or operations, actionable reports provide the clarity needed to optimize strategies and maximize ROI.
Creating impactful reports requires more than summarizing metrics. They must connect data to insights and inspire action. Here’s how you can create business reports that inform, persuade, and lead to measurable success.
Why Actionable Business Reports Matter
Most businesses often treat reports as formalities rather than tools for decision-making. Reports fail in this role when they lack focus, overload visuals, or cannot tie insights to goals. Without actionable elements, they become just another document gathering dust.
For marketing professionals managing multiple campaigns, data analysis for marketing plays a critical role in identifying trends and optimizing strategies. A well-structured report uncovers opportunities and guides resource allocation. Imagine a campaign report emphasizing declining engagement but failing to explain the reasons behind it. Actionable reports solve this problem by identifying the issue and recommending the next steps, such as adjusting ad messaging or reallocating the budget.
This approach ensures clarity and direction, making business reports indispensable for decision-making.
Source: The Importance of Actionable Reporting in BI & Reporting Best Practice
Steps to Creating Actionable Business Reports

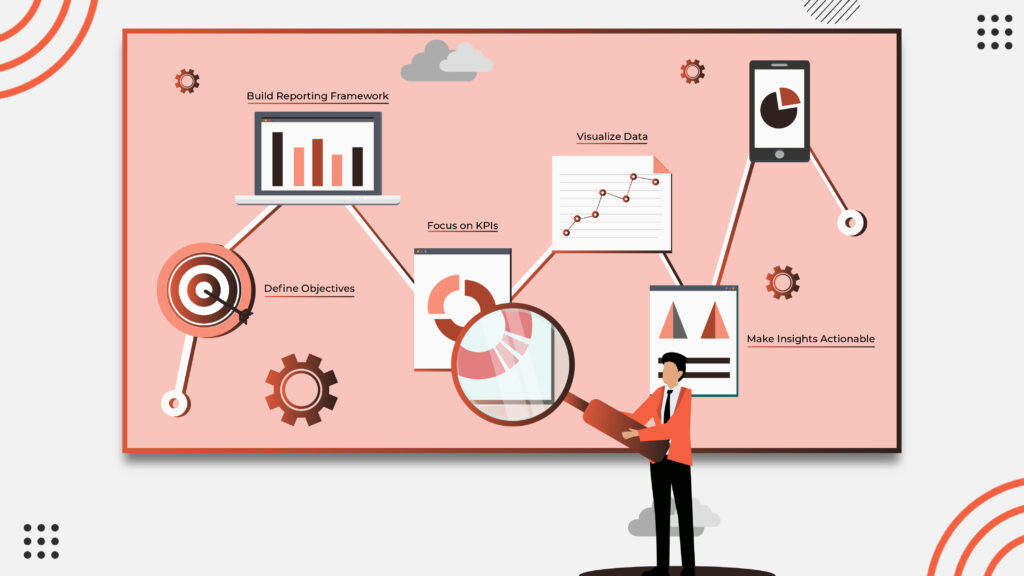
1. Define Clear Objectives
Every great report starts with a clear purpose. Before diving into data, determine what the report aims to achieve. Are you looking to measure performance, uncover trends, or solve a specific problem? Clearly defined objectives ensure the report stays focused and delivers value to decision-makers.
2. Build a Comprehensive Reporting Framework
A strong reporting framework incorporates foundational metrics, explores key trends, and offers strategic insights. Foundational reports, often created using marketing reporting templates, provide a snapshot of performance, answering essential questions like revenue generated or customer acquisition costs.
Marketing analytics reports dig deeper, identifying challenges or patterns, such as underperforming audience segments or high-performing campaigns. Strategic reports use these findings to shape actionable recommendations, helping teams allocate resources efficiently and plan for the future.
3. Focus on Relevant KPIs
Key Performance Indicators (KPIs) are the compass that ensures reports align with your business goals. Metrics such as Customer Acquisition Cost (CAC), which tracks the efficiency of acquiring new customers, provide insight into where resources are best spent. Gross Margin Return on Investment (GMROI) reveals how well inventory investments are paying off, while Customer Retention Rate (CRR) evaluates how effectively you’re retaining loyal customers.
Choosing relevant KPIs means focusing on the metrics that directly inform your strategy, ensuring every decision is both data-driven and impactful.
4. Enhance Understanding with Visualizations
Data visualization simplifies complex information, making it easier to interpret and act upon. Effective visuals, such as bar charts, funnel diagrams, and heatmaps, highlight trends and uncover opportunities.
For example, a funnel chart can pinpoint where prospects drop off in the sales process, while a heatmap reveals user behavior on websites or campaigns. These tools ensure teams focus on critical insights quickly and clearly.
“Clear, impactful visuals transform raw numbers into actionable insights.”
Make Insights Actionable
Reports should go beyond presenting data—they need to offer clear direction. For instance, if Campaign A exceeds its budget by 30% but Campaign B delivers 50% higher ROI, shifting resources to Campaign B becomes an obvious next step. Similarly, identifying a 10% increase in customer churn might prompt a re-engagement campaign to win back inactive users. Actionable insights connect the dots between what the data says and what you need to do next, making them the driving force behind effective decision-making.
Source: Top 8 Best Practices for Effective Business Reports
“Reports should go beyond presenting data—they need to offer clear direction.”
From Visuals to Action: Making Data Work for You
Clear, impactful visuals transform raw numbers into actionable insights. Well-designed visuals highlight trends, uncover opportunities, and guide teams to make informed decisions. Without effective visualization, even the best data can go unnoticed or be misinterpreted.
Here are three visual reports that every business can use to translate data into action:
1. Sales Funnel Report
Sales funnel reports map the customer journey, illustrating where prospects drop off. Funnel charts highlight bottlenecks, helping businesses refine processes and improve conversions.
- Example: Retailers might identify a high drop-off rate at checkout, signaling a need to simplify payment options or add trust badges.
- Actionable Insight: Focus resources on removing obstacles in critical stages to enhance conversion rates.
2. Engagement Heatmap
Heatmaps identify where users engage the most and where they lose interest. These insights help teams refine layouts and calls to action, ensuring a smoother and more engaging user experience.
- Example: A heatmap might show users engaging with product images but missing key calls to action, prompting layout changes.
- Actionable insight: optimize website or campaign design to guide users toward desired actions, improving engagement rates.
3. Campaign ROI Report
Using sales reporting software, ROI reports combine pie charts and bar graphs to compare performance across campaigns.
- Example: A marketing team might discover that paid social ads generate higher ROI than email campaigns.
- Actionable Insight: Shift budgets to scale high-performing channels while cutting underperforming ones.
These visual reports provide clarity, but they’re only the first step. The real value lies in turning the insights they reveal into specific actions. For example, heatmaps that highlight underperforming buttons prompt immediate changes, while ROI reports showing under-used channels guide smarter resource allocation.
Visualization isn’t just about understanding data—it’s about using that understanding to make better decisions. Paired with automation, these insights become dynamic tools for real-time strategy adjustments, keeping businesses ahead in competitive markets.
Automate Reporting Where Possible

Businesses managing data across multiple platforms often find manual reporting to be a drain on time and resources. Automation addresses these challenges by leveraging report automation tools to streamline the reporting process, minimize human error, and ensure teams have access to accurate insights when they need them most.
Here’s how businesses can leverage automation to enhance their reporting:
1. Seamlessly Integrate Data Across Platforms
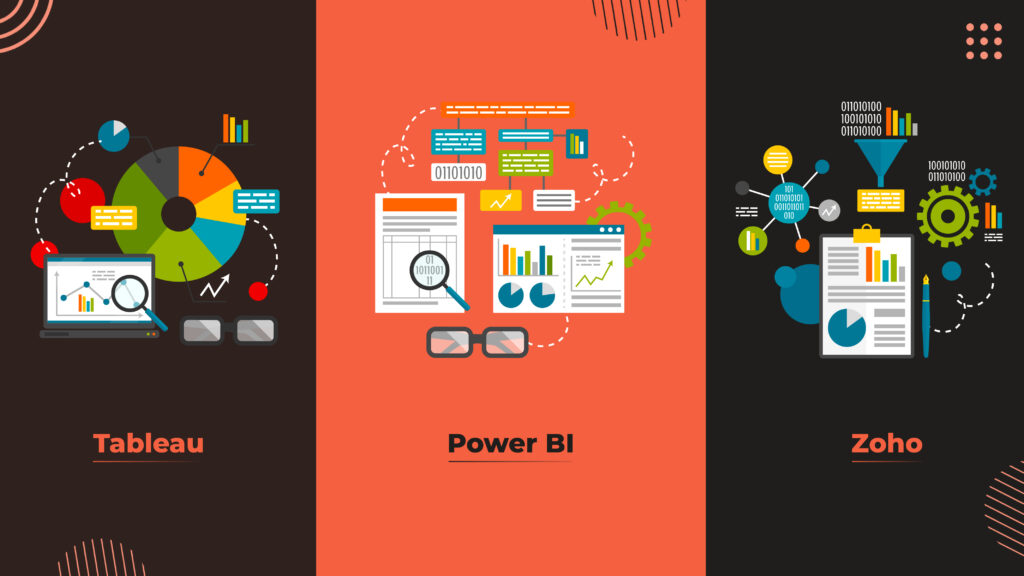
Tools like Tableau and Power BI are critical for business intelligence reporting, bringing together data from multiple sources into a single, interactive dashboard, enabling real-time reporting for faster decision-making. They eliminate the need for manual data collection by updating metrics in real time through their automation features.
Integrating data analysis for marketing allows teams tracking campaigns on Google Ads, social media platforms, and CRMs to benefit from merged, consolidated insights that enable faster and more informed change.
2. Simplify Operational and Financial Reporting
Automation extends beyond marketing to improve efficiency in operations and finance. Reporting automation tools like Zoho Analytics generate recurring financial summaries by pulling data directly from accounting software. This allows businesses to identify profit trends or cost overruns quickly. Operational teams can use automated reports to monitor supply chains, track production schedules, and address inefficiencies before they escalate.
3. Strengthen Collaboration Across Teams
Shared dashboards, updated automatically, align marketing, operations, and sales teams around the same data set. With the help of business reporting software, automation ensures everyone is working with consistent real-time reporting, reducing miscommunication and improving coordination. Teams no longer need to wait for manually compiled reports, enabling faster decision-making across departments.
Automation: The Engine of Smarter Reporting
Automated reporting doesn’t just save time—it ensures accuracy, promotes collaboration, and provides timely insights. With tools that deliver real-time data and eliminate repetitive tasks, businesses can focus on analyzing insights and implementing strategies that drive measurable results.
Source: What Is Actionable Reporting?
How Actionable Reports Impact ROI
Actionable reports directly contribute to ROI by enabling swift, informed decision-making. Imagine reallocating ad spend mid-campaign based on real-time data, improving returns by 20%. Reports also improve collaboration by uniting teams around common objectives and guaranteeing efficient use of resources. Most importantly, they allow businesses to refine strategies over time, achieving continuous growth.
Industries That Benefit Most from Actionable Reporting
Every industry generates data, but the use of that data determines its value. Actionable reporting tailors insights to specific industry challenges, enabling businesses to make informed decisions and achieve measurable outcomes.
Retail
Retailers rely on actionable reports to forecast demand and prevent inventory shortages during peak seasons. These insights ensure timely replenishment and help optimize resource allocation.
Manufacturing
Manufacturers use actionable reporting to optimize operations, monitor equipment performance, and reduce downtime. By identifying recurring maintenance needs, they can schedule repairs proactively and avoid costly production delays.
Healthcare
Actionable reports in healthcare improve patient care by identifying inefficiencies like long wait times. These insights help adjust staffing and allocating medical supplies to the most critical areas.
Finance
Financial institutions rely on actionable reports to forecast market trends and manage risks. Identifying underperforming assets allows for timely rebalancing strategies, protecting investments, and improving long-term returns.
Education
Educational institutions use actionable reports to track student outcomes and identify areas for improvement. Insights into performance trends help refine curriculum and allocate resources effectively.
Tech Startups
Tech startups leverage actionable reports to track user engagement and improve feature adoption. These insights not only streamline onboarding processes but also guide product development by identifying which features drive user satisfaction.
Across industries, actionable reports turn data into meaningful insights that address specific challenges and drive measurable results. They transform raw data into practical solutions for long-term success.
Source: What is Business Reporting and Why is It Important for Data-Driven Decision Making?
Actionable Insights, Measurable Success
Turning data into decisions is the key to driving growth in today’s competitive landscape. Actionable reports provide more than just information—they empower businesses to optimize strategies, align teams, and achieve measurable outcomes. From foundational metrics to advanced analytics, every report should inspire action and support your long-term goals.
Actionable reporting transforms raw data into clear, practical strategies that drive growth. By integrating these principles, businesses can improve efficiency, enhance collaboration, and achieve long-term success. Whether you’re refining marketing strategies, streamlining inventory management, or improving customer retention, actionable reporting serves as the roadmap to success.
Ready to turn your data into measurable success?
Let Ready Logic help you transform insights into action with tailored reporting solutions designed to streamline your strategies and maximize ROI.
Contact us today to get started!
A regular business report often summarizes data without providing context or guidance. It might tell you how many sales you made or what your expenses were, but it doesn’t explain why those numbers matter. An actionable business report, on the other hand, ties data to specific recommendations. Consider a scenario where sales have declined—an actionable report would go further by recommending resource reallocation to higher-performing products or regions to recover lost revenue. Actionable reports empower decision-makers by connecting insights to clear next steps.
Start by identifying your business goals. Are you focused on acquiring more customers, improving efficiency, or increasing profitability? Choose KPIs that directly align with these objectives. For instance:
- If growth is your goal, focus on Customer Acquisition Cost (CAC) or Lead Conversion Rates.
- If efficiency matters, track metrics like Gross Margin Return on Investment (GMROI).
- For customer loyalty, consider Customer Retention Rate (CRR).
Always prioritize KPIs that provide actionable insights rather than generic metrics.
Focus on clarity and relevance. Start with the end in mind—what decisions need to be made? Structure your reports to answer these questions directly. For instance:
- Use visuals to highlight trends or anomalies.
- Include a section for actionable recommendations tied to specific data points.
- Avoid overwhelming readers with too many details; instead, prioritize what drives decisions.
Actionable insights should always lead to clear, implementable steps.
The need for real-time reports depends on your business type and goals. For fast-paced industries like e-commerce or digital marketing, real-time data can help you adjust campaigns or inventory instantly. However, weekly reporting may suffice for businesses with slower cycles, such as manufacturing or education. The key is to balance timeliness with relevance, ensuring your reports provide the insights you need without unnecessary complexity.
Some common pitfalls include:
- Overloading visuals: Too many charts or graphs can confuse rather than clarify.
- Focusing on irrelevant metrics: Reports should align with business goals, not just collect data for the sake of it.
- Neglecting recommendations: A report without actionable next steps is incomplete. Avoid these mistakes by keeping reports clear, concise, and goal-oriented.
Effective data visualization requires simplicity and relevance. Choose the right chart type for your data:
- Use bar charts for comparisons.
- Funnel charts are great for visualizing customer journeys.
- Heatmaps highlight areas of activity or interest.
Always focus on readability and ensure your visuals complement the insights you’re trying to convey.
Yes, most modern reporting tools are designed to integrate seamlessly with existing platforms. For example:
- Google Data Studio connects with Google Analytics, Ads, and Sheets.
- Power BI integrates with CRMs like Salesforce and project management tools like Trello.
- Zoho Analytics works with accounting software, email platforms, and more.
Before selecting a tool, verify compatibility with your current systems to ensure a smooth workflow.
Prioritize KPIs based on the report’s goal. If the focus is on campaign performance, highlight metrics like ROI, engagement rates, and conversion rates. Group related KPIs together and use summaries to avoid overwhelming readers. For example, a dashboard might show overall ROI at the top with supporting metrics like cost-per-click and audience engagement below. The structure helps readers focus on the big picture first before diving into details.
Actionable reporting improves ROI by enabling better decisions. For example:
- Identifying underperforming campaigns helps reallocate budget to higher-performing ones.
- Tracking customer retention highlights opportunities for re-engagement, reducing churn.
- Analyzing product sales trends allows you to focus on high-margin items.
Every insight drives a specific action that optimizes resources and maximizes returns.
